

Multi-fact relationships, Customise Genie One & more - What's New in Databricks AI/BI Genie July 2026
Learn about the new Genie Ontology, multi-fact relationships in dashboards, Genie now available in DABs and lots more!


What we will cover today
So much happened in one month that it is almost hard to keep up. We tried to summarise the most interesting developments in this post:
Genie Ontology maps and ranks your business’s knowledge
Genie One has evolved into your agentic coworker
Customise your Genie One homepage
Multi-fact relationships and cross-dataset measures
Reshape visuals on the fly with dashboard variables
Add Genie visuals to a Databricks dashboard
DABs (Declarative Automation Bundles) now supports Genie Spaces
Control Genie’s cost with Unity AI gateway
Genie Ontology maps and ranks your business’s knowledge
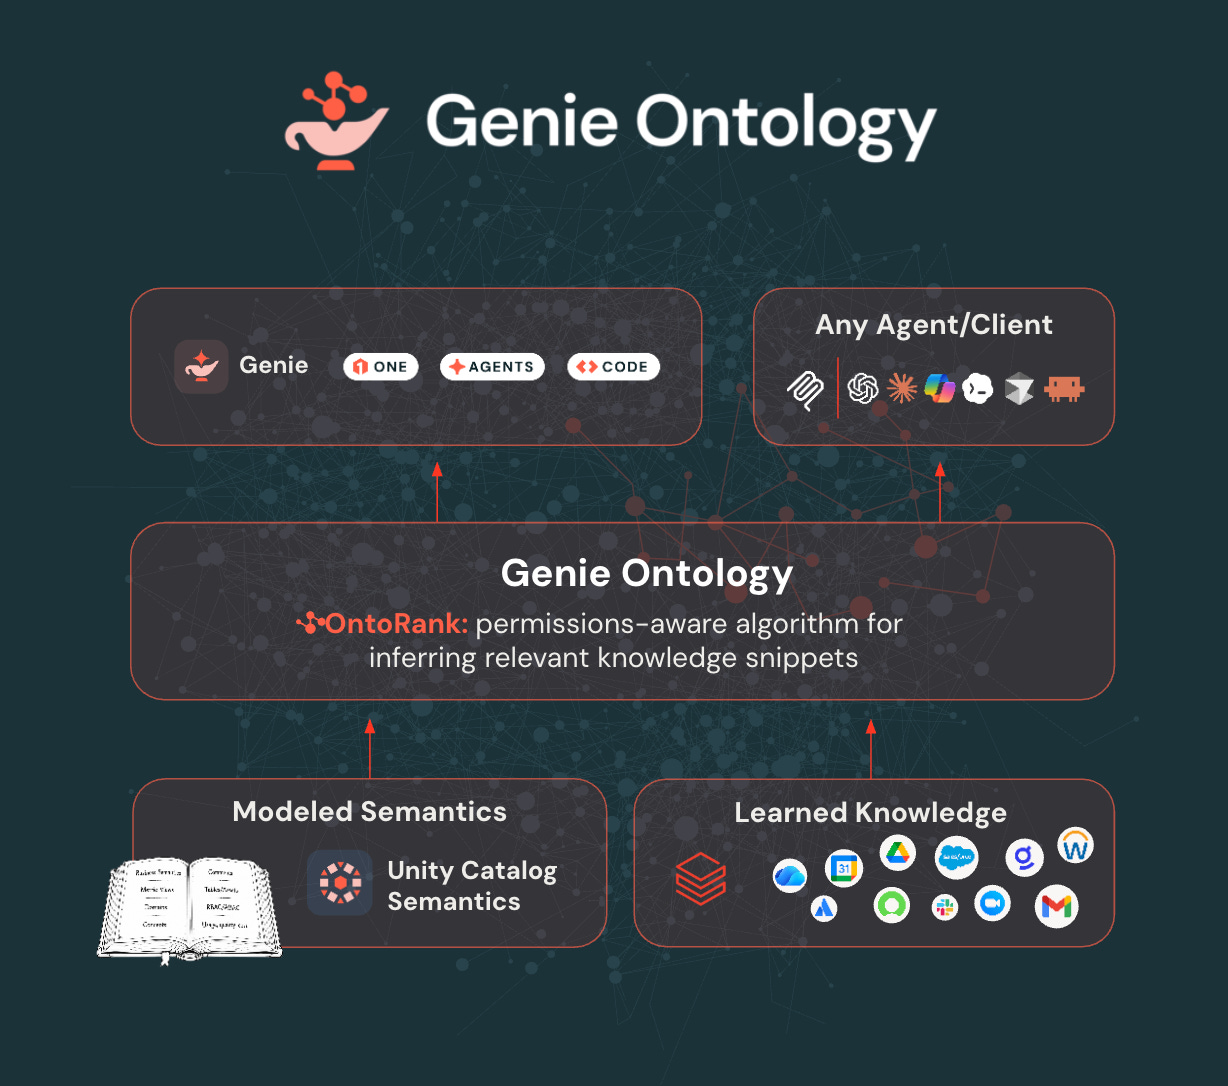
Most enterprise AI stumbles for one reason; the context needed to answer a question is scattered across dashboards, queries, pipelines, wikis, tickets, and chat threads. Genie Ontology fixes that. It automatically extracts knowledge from your tables, queries, dashboards, pipelines, and connected apps, then organises it into a living graph of how your company actually works; metric definitions, business terms, custom calculations, and the relationships between them. It even ranks sources using a PageRank-inspired approach (called OntoRank) that weighs authority, usage, freshness, and ties to certified assets. The payoff: 84.5% of questions answered correctly on the first try, and 2× faster than the strongest alternative, making it cheaper in the long-run than generic models.
Genie One has evolved into your agentic coworker
Genie One (f.k.a. Databricks One) began as the entry point for business users to access AI/BI Dashboards, Genie Spaces, and Databricks Apps. It is now becoming the central entry point for every knowledge worker, not just the BI crowd. With per-user authentication it can reach beyond your tables into your email and documents, answering from the sources you already work in and only the ones you personally have access to. It can also run scheduled tasks on its own, like refreshing a metric or sending a recurring summary, and the new custom skills let you teach Genie One reusable, personal actions so you do not have to re-explain the steps each time.
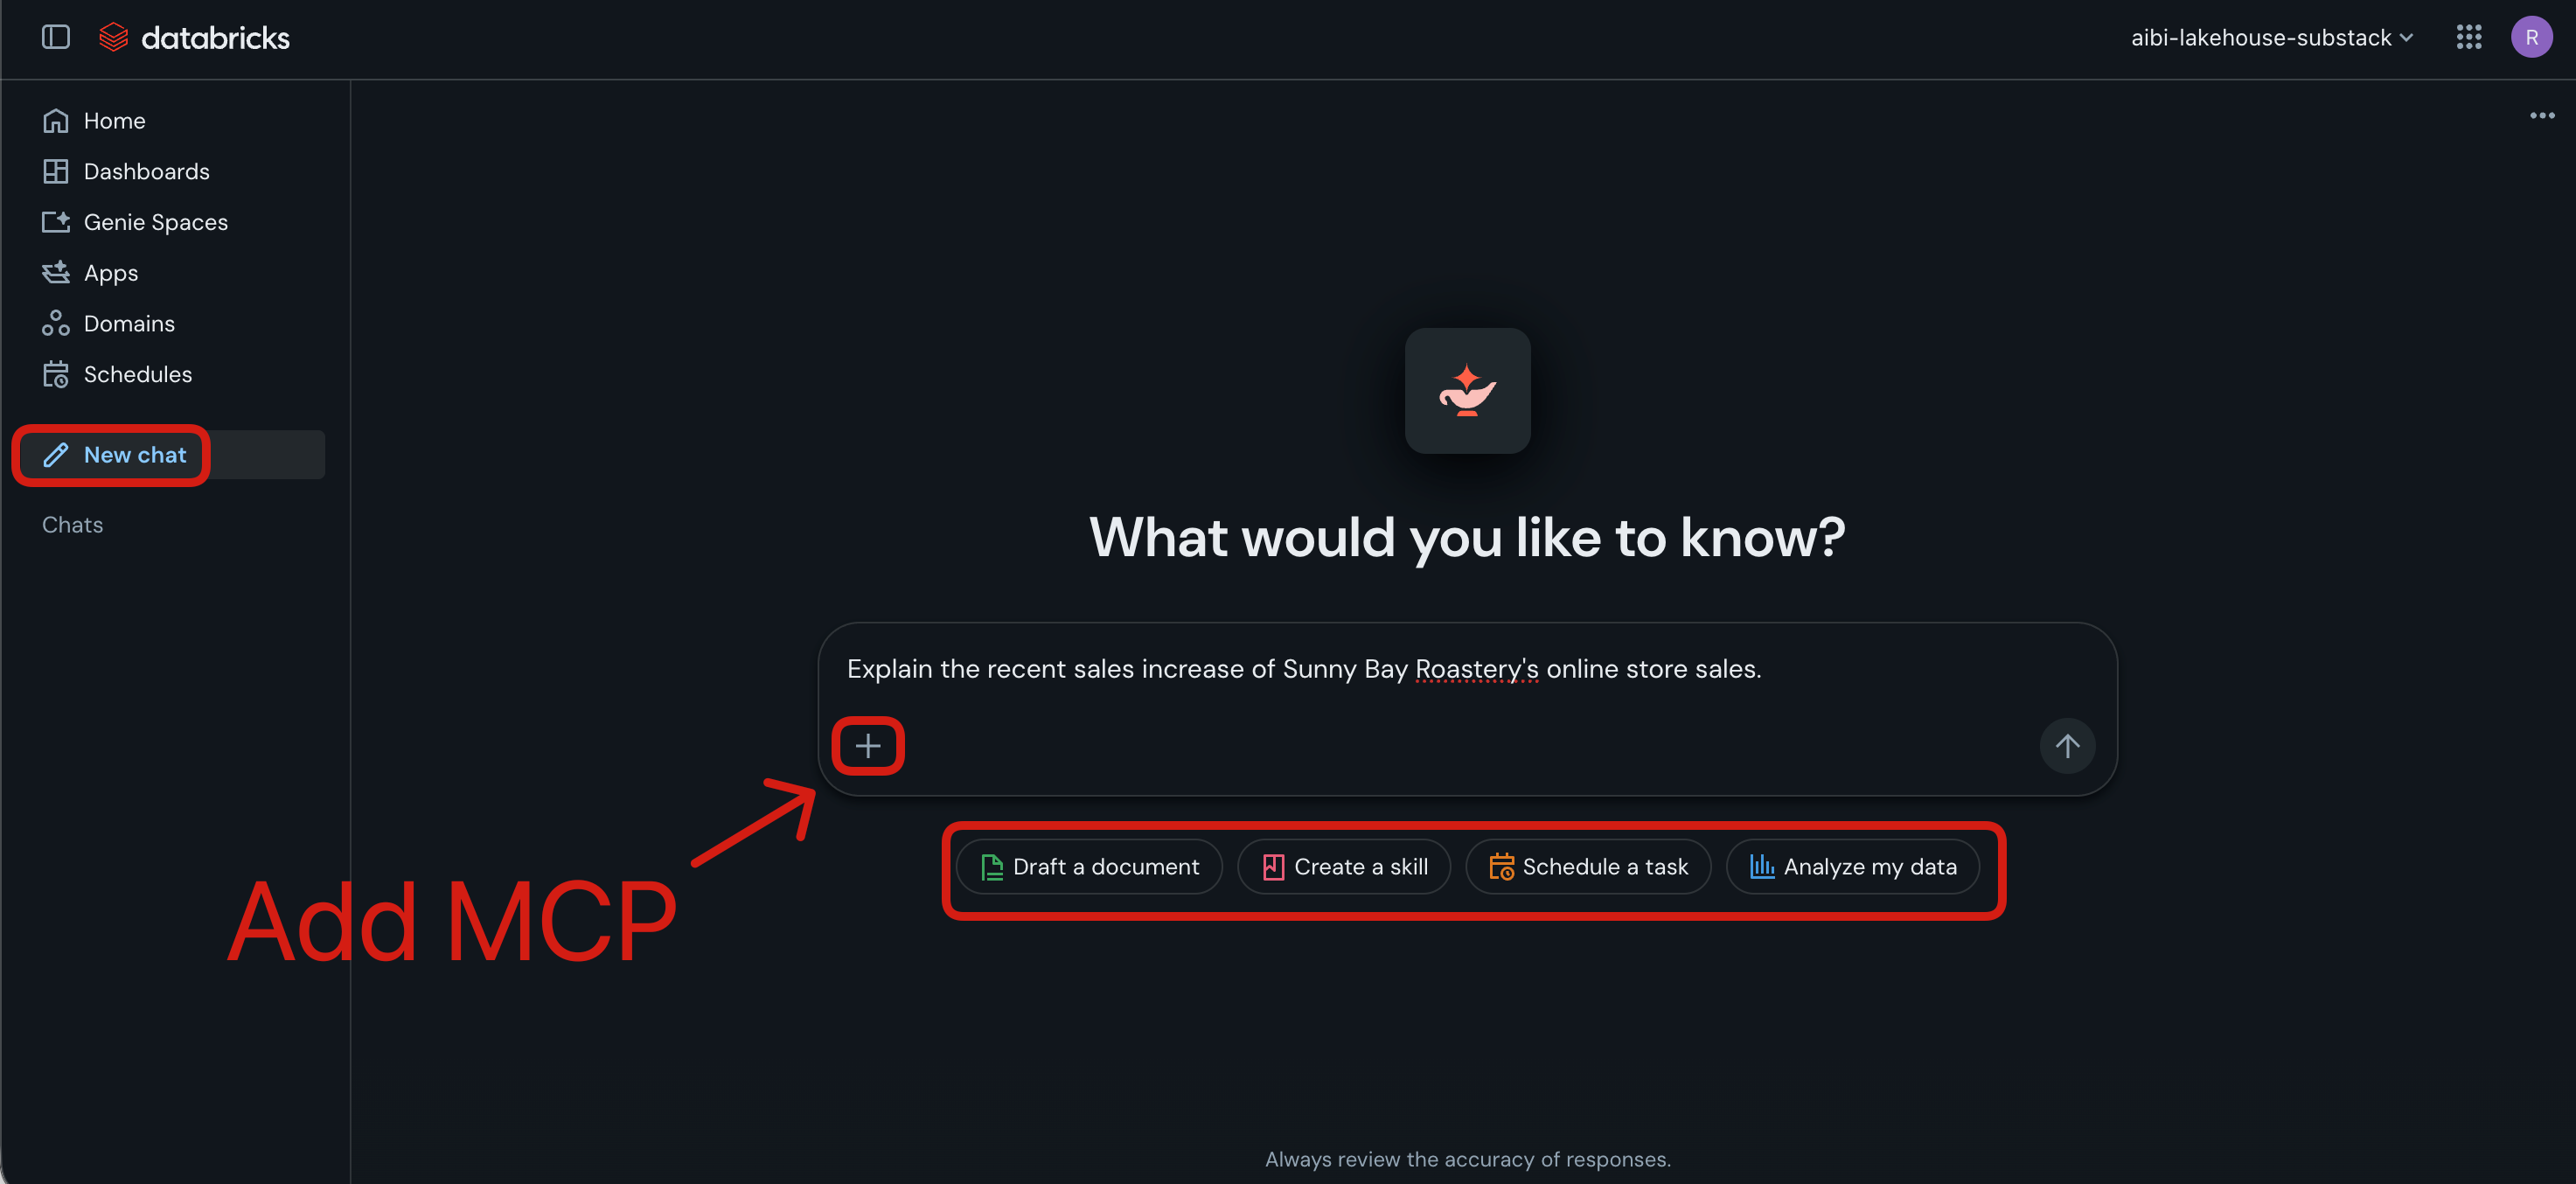
Give it a try: open Genie One in your workspace, connect a source, and hand it a recurring task you would rather not do by hand.
Customise your Genie One homepage
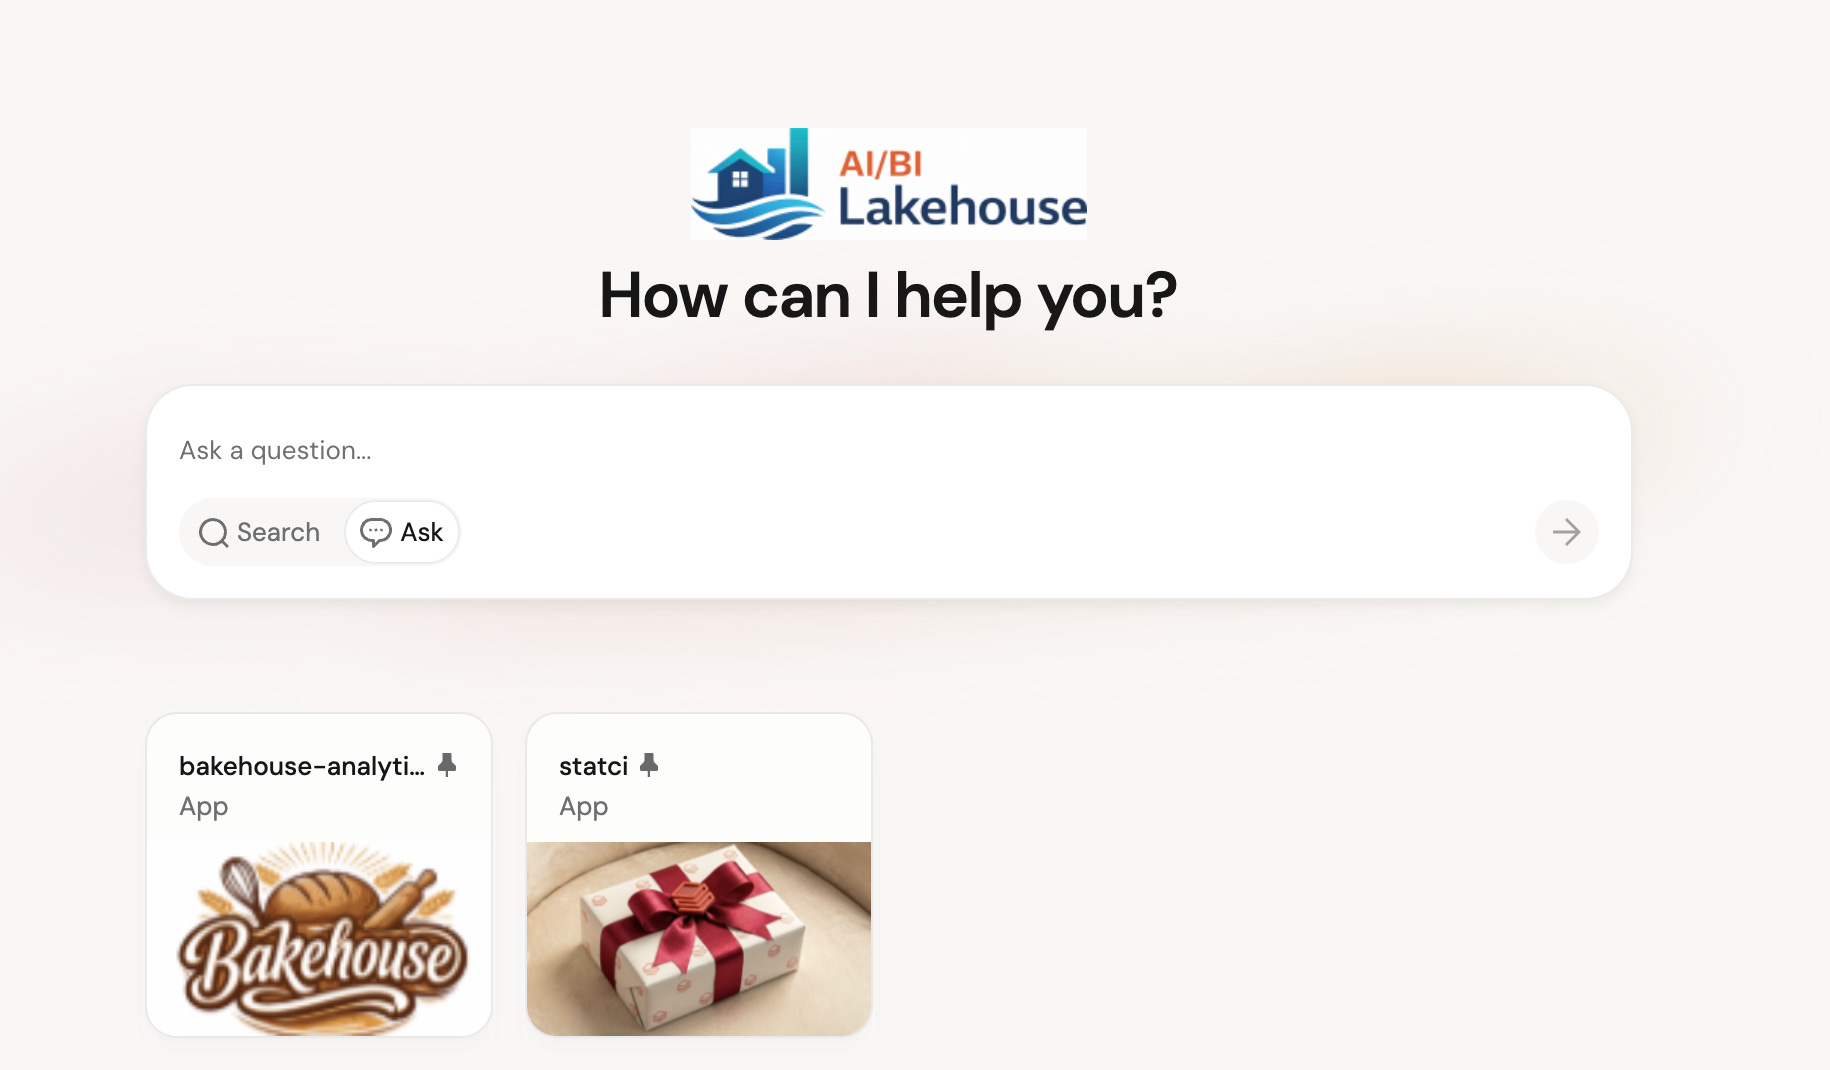
Workspace and account admins can now make Genie One feel like home. Customise the homepage with your brand colors, company logo, a markdown welcome message, and pin recommended Genie Spaces, Apps or dashboards so your team sees the most relevant content the moment they log in. It’s a small change that makes a big difference for adoption especially when onboarding new business users.
What you can customise:
Company logo
Brand colour
Markdown welcome message (links, announcements, etc.)
Pinned content (Genie Spaces, dashboards, and other assets)
Multi-fact relationships and cross-dataset measures
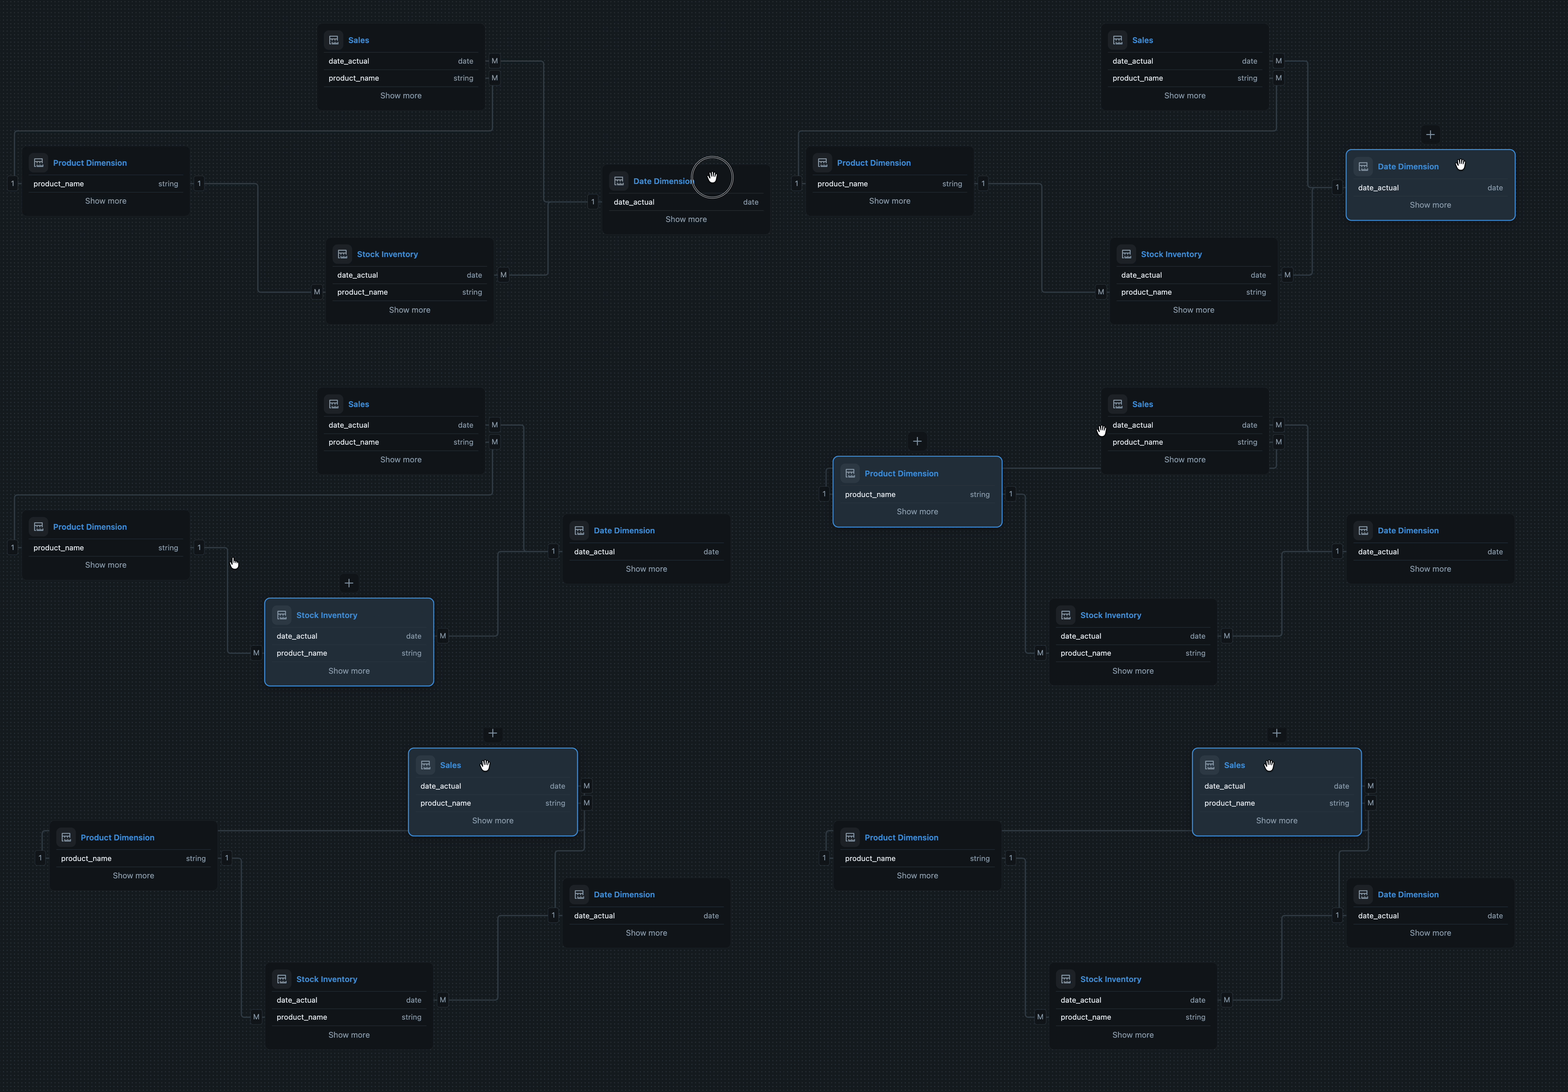
A star is not enough? Use a galaxy! You can now model more than one fact table in the same dataset and write measures that reach across them. In the example below, Sales and Stock Inventory both join to shared Product and Date dimensions, so a single dashboard can line up units sold against units on hand without stitching the tables together in SQL first. Each fact keeps its own grain on the many side of the relationship, while the conformed dimensions sit on the one side, turning a single star schema into a full galaxy. That means cross-dataset measures like sell-through rate or days of cover come straight from the model.
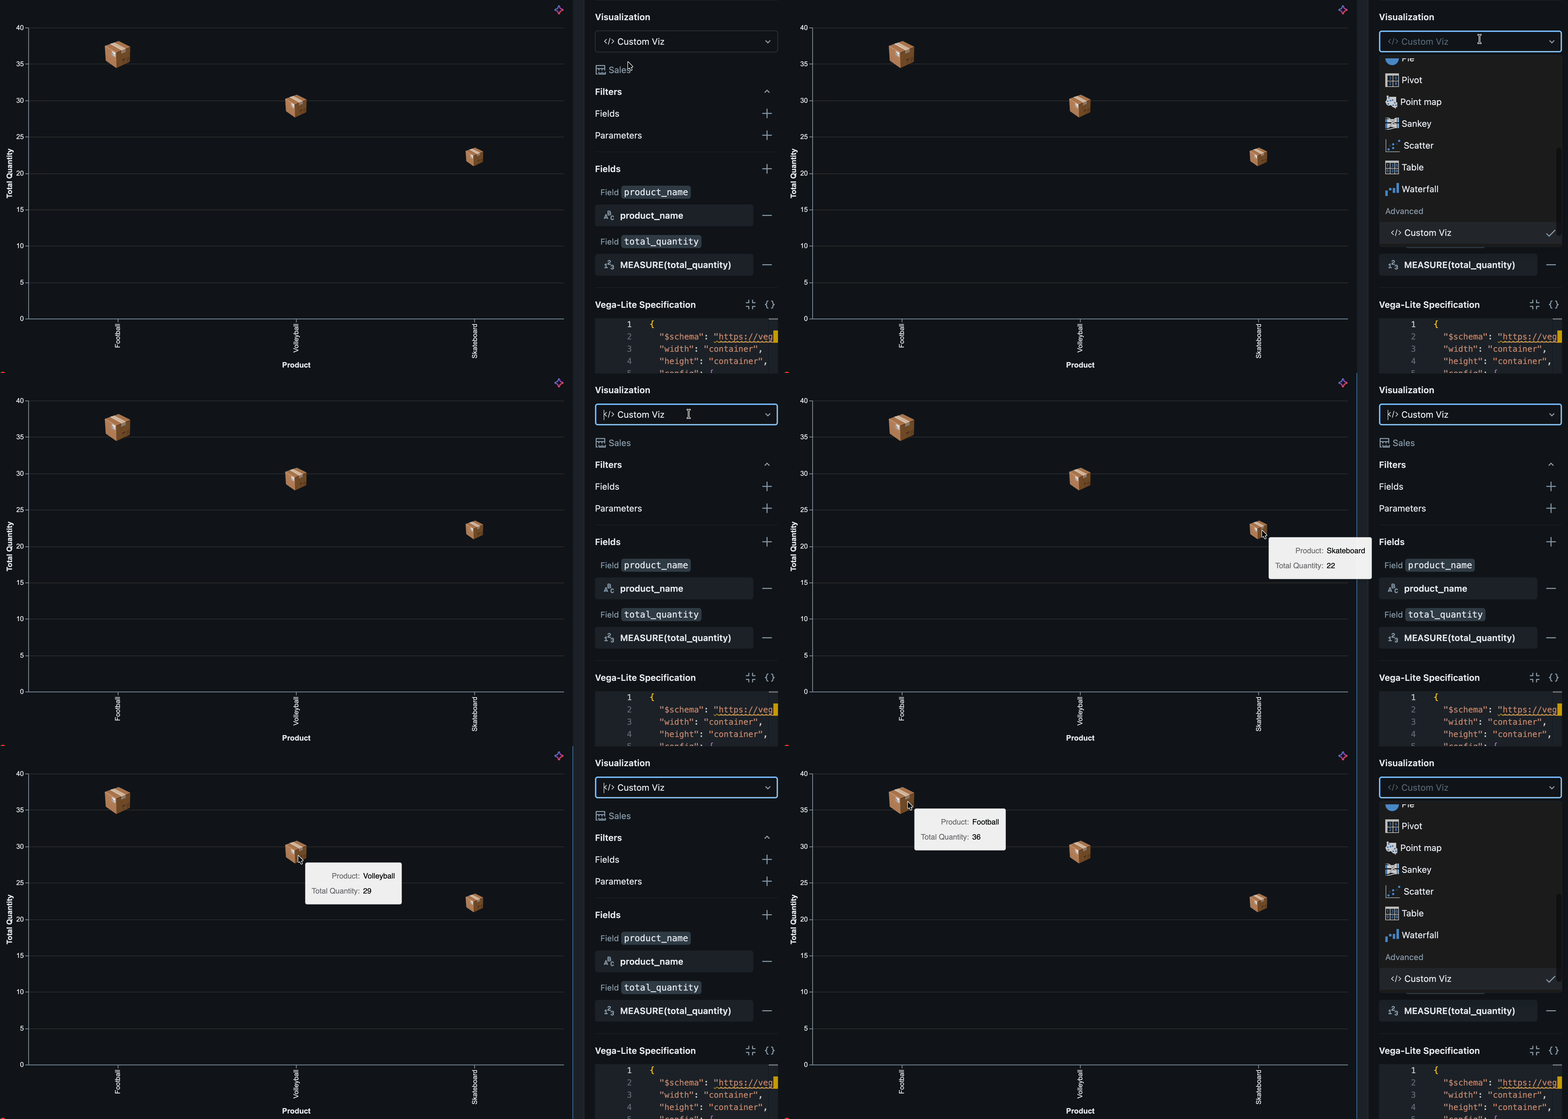
Custom visualisations with Vega-Lite
You did not find the exact type of visual you want to use in your AI/BI Dashboard? You no longer have to search for the built-in chart types. Custom visualisations let you define your own charts with open Vega-Lite library.

You keep full control over marks, encodings, and styling, while the chart still binds to your governed dataset and reacts to dashboard filters like any other widget.
Reshape visuals on the fly with dashboard variables
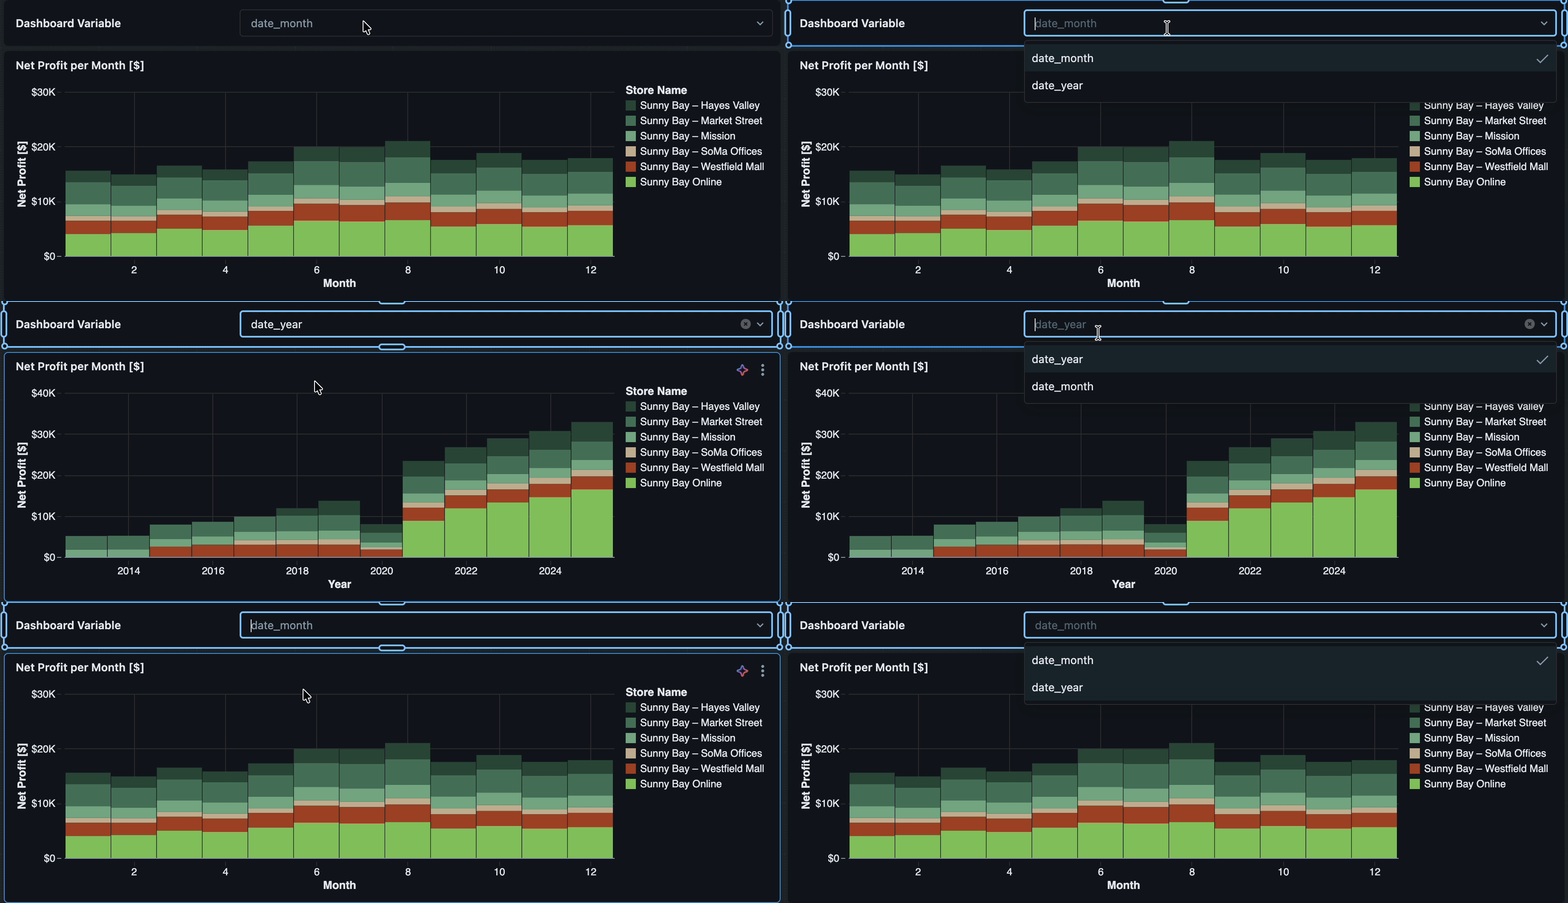
Dashboard authors can now define variables that let viewers swap the fields on a visualization without touching the dashboard itself. Point a variable at a set of fields, wire it to a chart’s axis or breakdown, and readers can flip betweenfor example monthlr or yearly granularity from a single dropdown. One dashboard now covers what used to take several near-duplicate charts, and every view stays governed by the same underlying dataset.
DABs (Declarative Automation Bundles) now supports Genie Spaces
You can now define and deploy Genie Spaces as infrastructure-as-code with Declarative Automation Bundles (DABs). The new genie_spaces resource lets you version-control a Genie Space’s title, description, warehouse, data sources, instructions, sample questions, and permissions right alongside your jobs and pipelines. Point it at a serialised geniespace.json file, run databricks bundle deploy, and promote the same space from dev to prod with confidence.
In practice, this makes it much easier to promote a curated Genie experience across environments using the same bundle workflow you already use for jobs, dashboards, and other resources.
# databricks.yml
bundle:
  name: nyc-taxi-genie
  engine: direct # genie_spaces require the direct deployment engine

resources:
  genie_spaces:
    nyc_taxi_genie:
      title: ‘NYC Taxi Trip Analysis’
      description: ‘Ask questions about NYC taxi trip data in natural language’
      warehouse_id: <warehouse-id>
      file_path: ./nyc_taxi_genie.geniespace.json
      permissions:
        - level: CAN_RUN
          group_name: users
⚠️ Requires the direct deployment engine.
Add Genie visuals to a Databricks dashboard
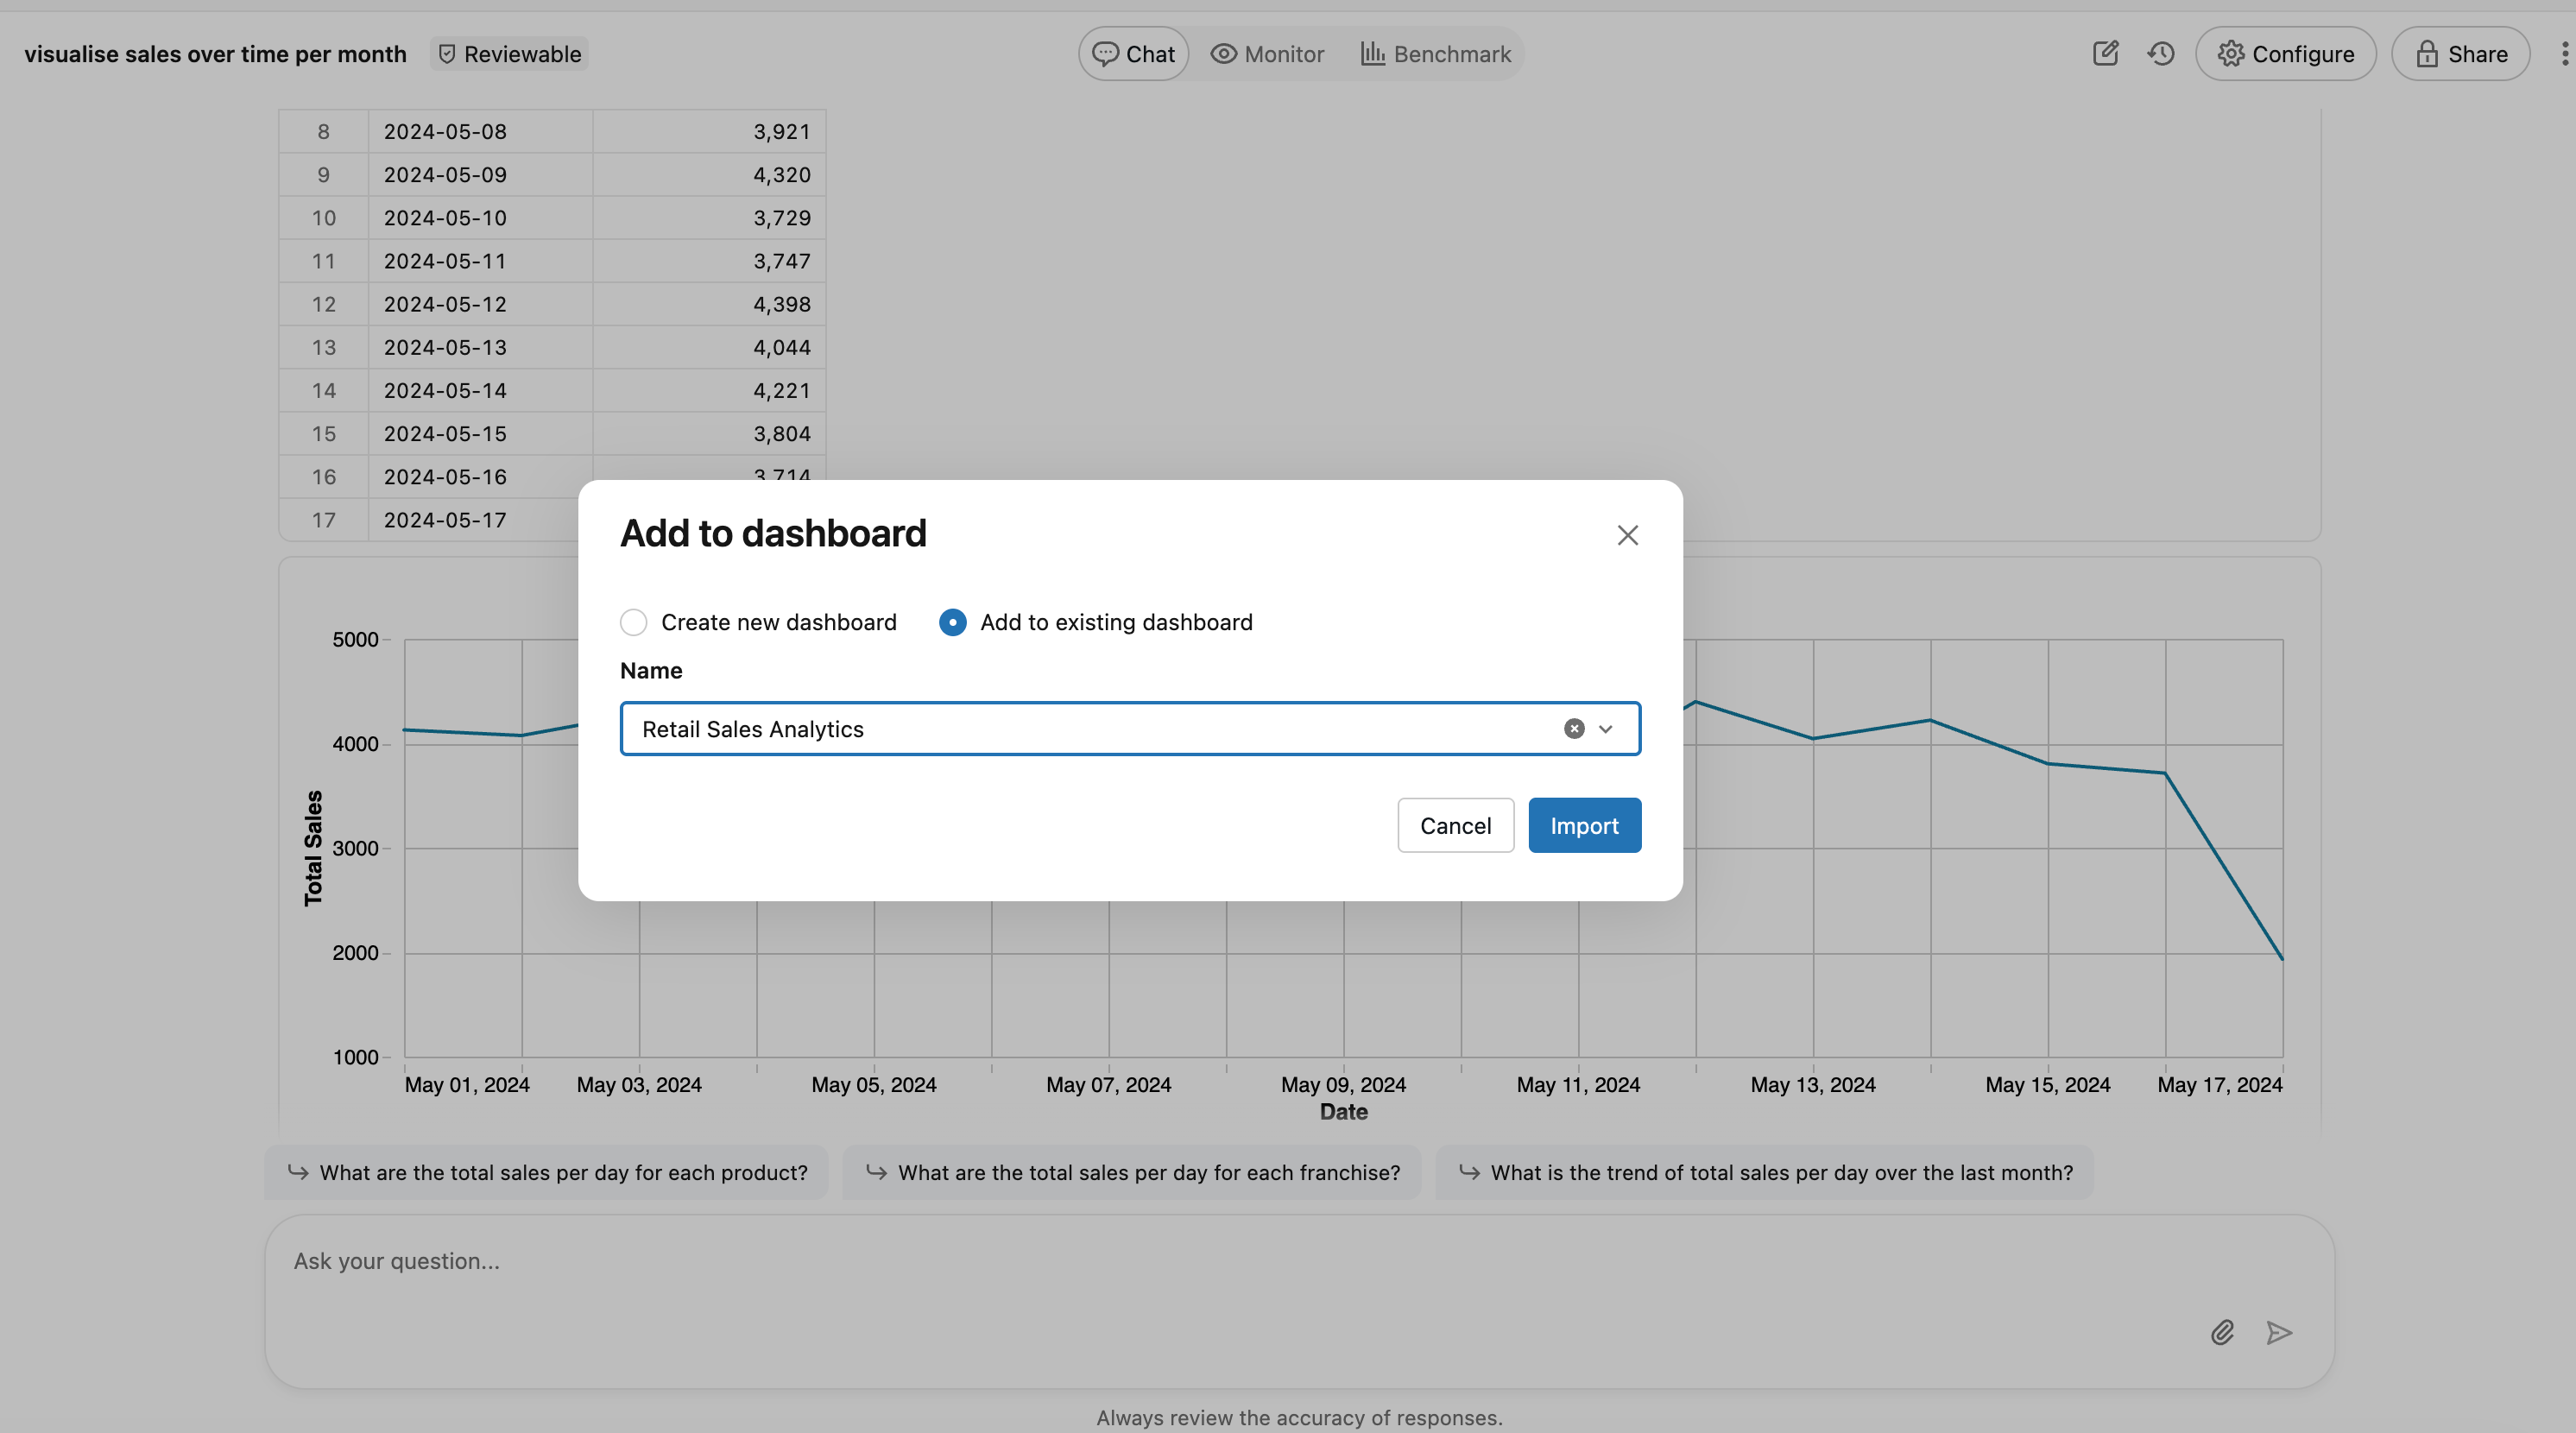
Found an insight in Genie worth keeping? You can now save any visualisation from a Genie Space response straight to a dashboard. Click the dashboard button in the upper-right corner and either create a new dashboard or drop it into an existing one. That helps teams move faster from ad hoc exploration in Genie to reusable, shareable dashboard content without rebuilding the visual from scratch. I’ve been looking forward to this one!
Control Genie’s cost with Unity AI Gateway
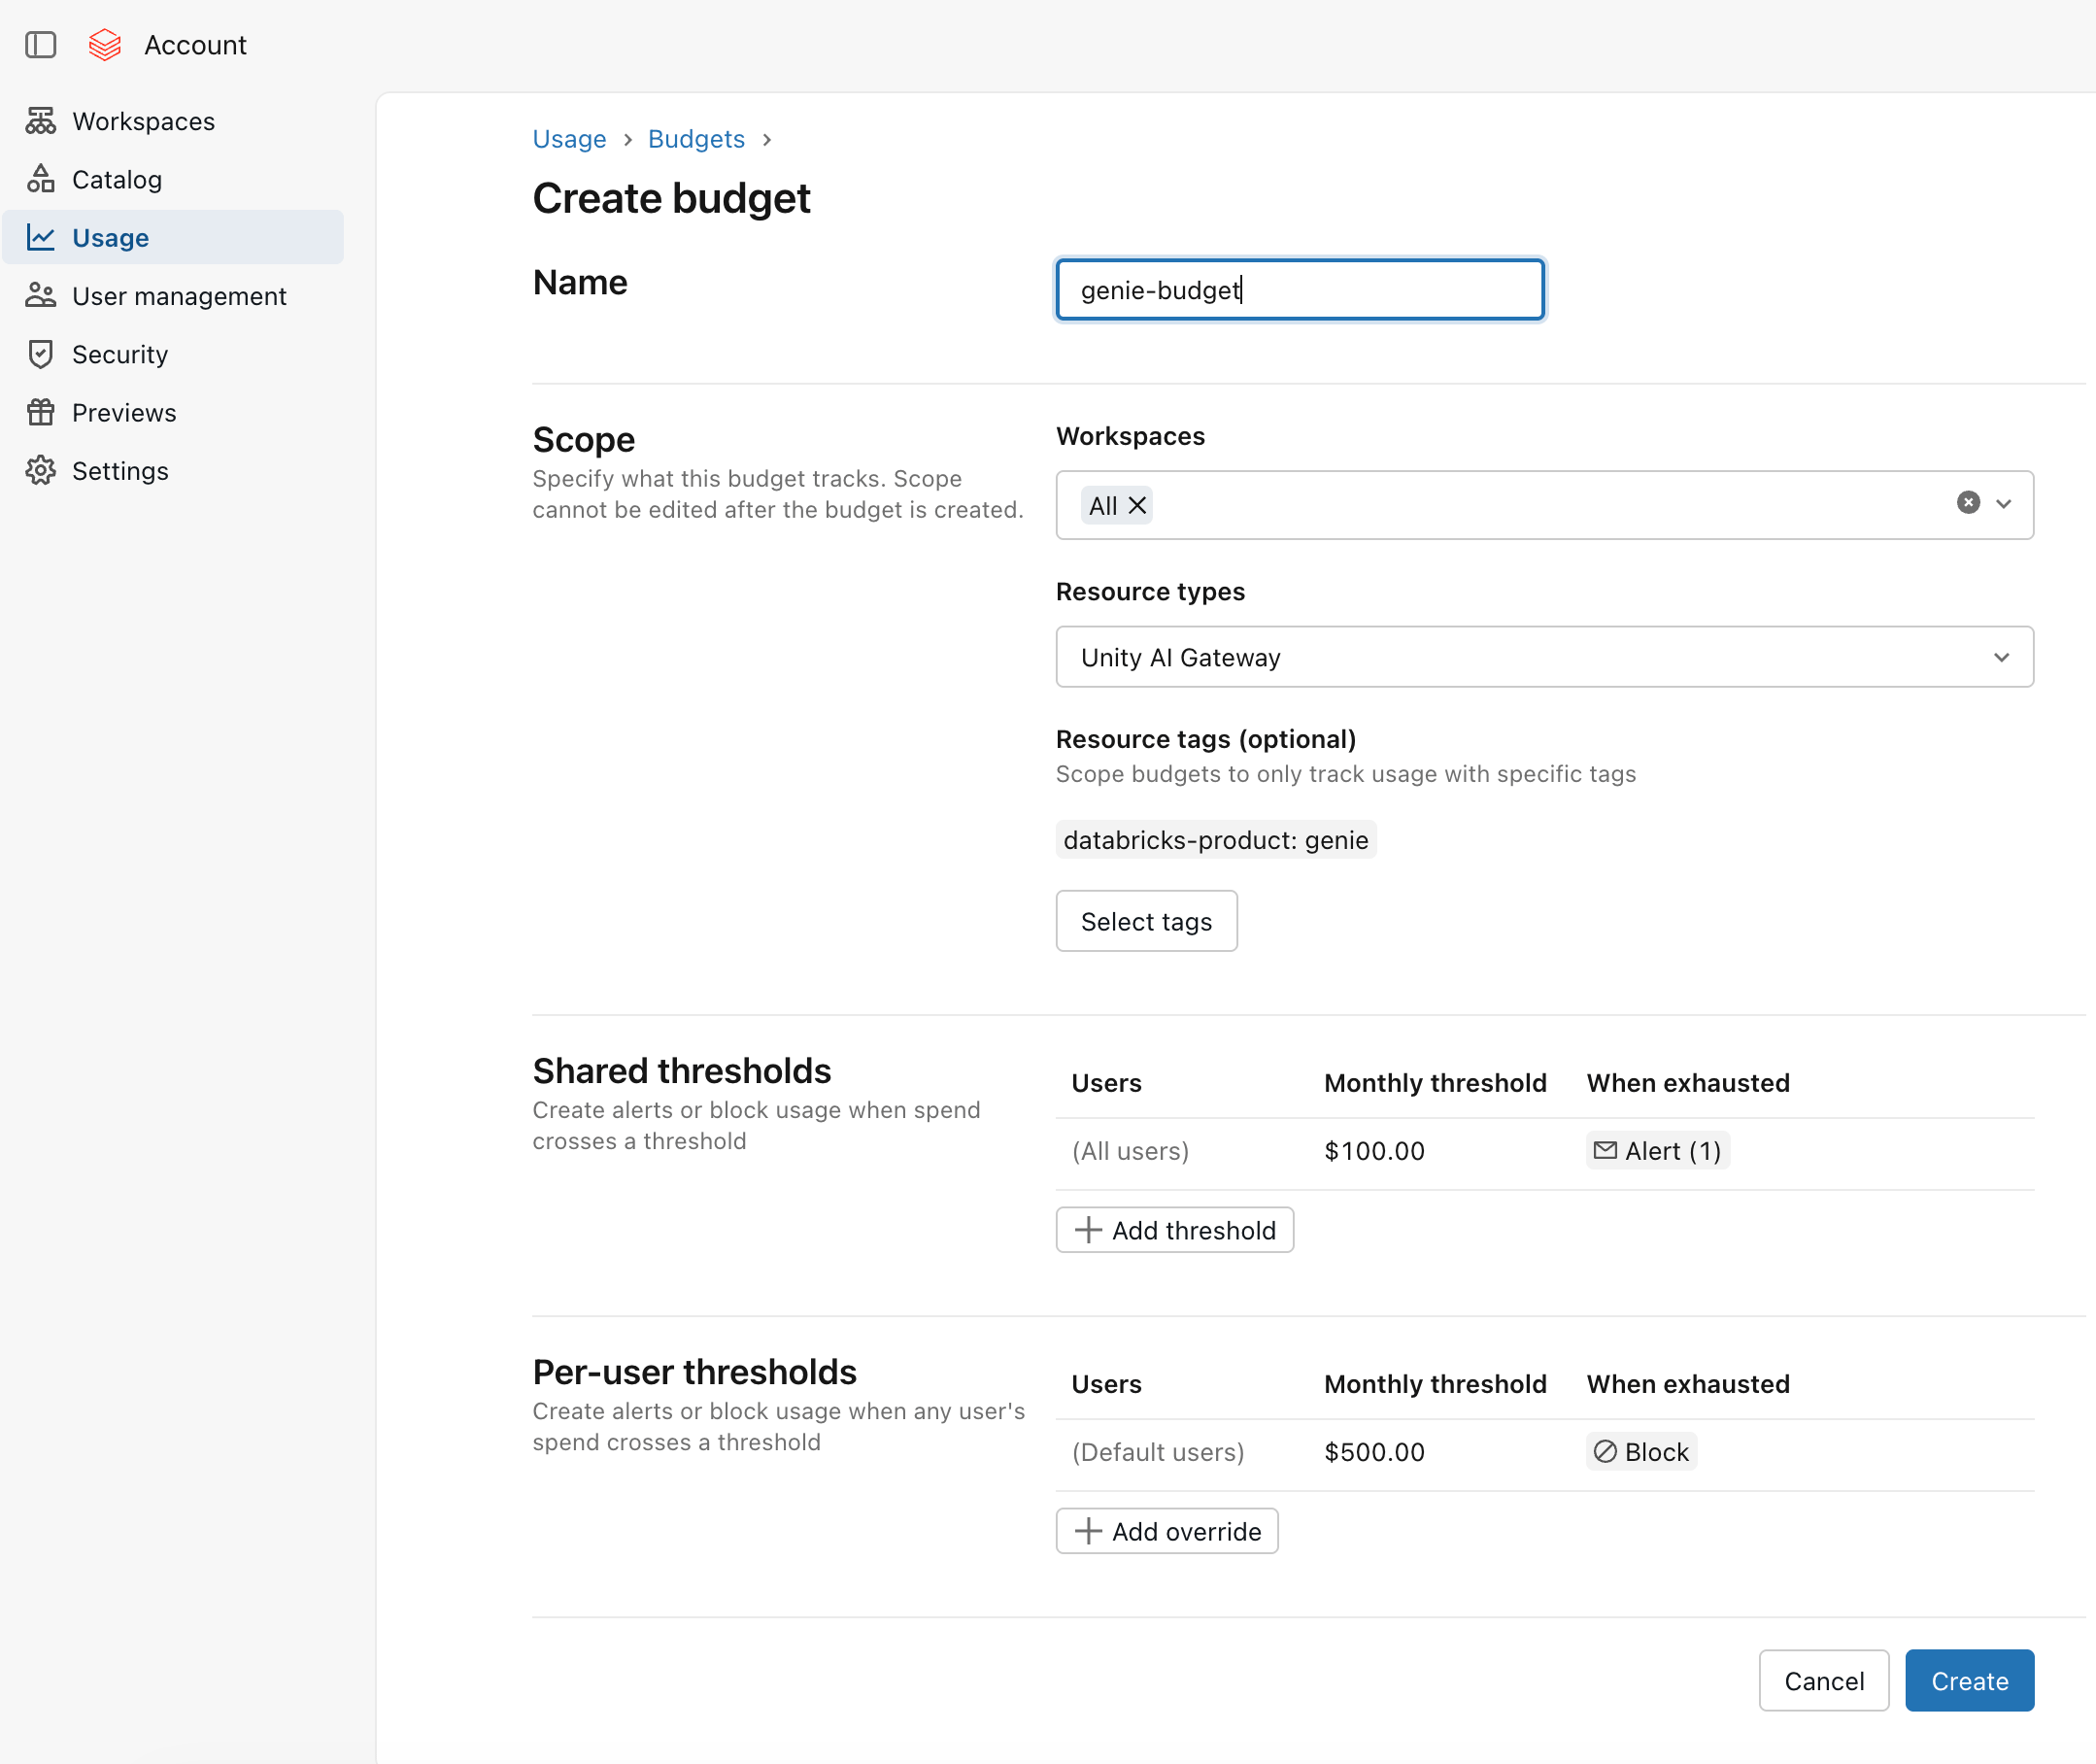
As Genie moves to pay-as-you-go billing beyond the free monthly allowance, account admins can now use Unity AI Gateway budgets to monitor and control spend. Budgets can be scoped across accounts, workspaces, groups, or individual users, with shared thresholds, per-user limits, alerts, and usage blocks to help teams scale adoption without losing cost control.
To set it up, an account admin just needs to login to the account console, create a budget under the “Usage” section, and select the databricks-product: genie resource tag. This tracks usage across all Genie products.